Some thoughts on the corona virus
I have been puzzled by this almost ubiquitous graph which health-officials are showing these days explaining why it is so important to slow the spread of the corona virus, more precisely known as covid19.
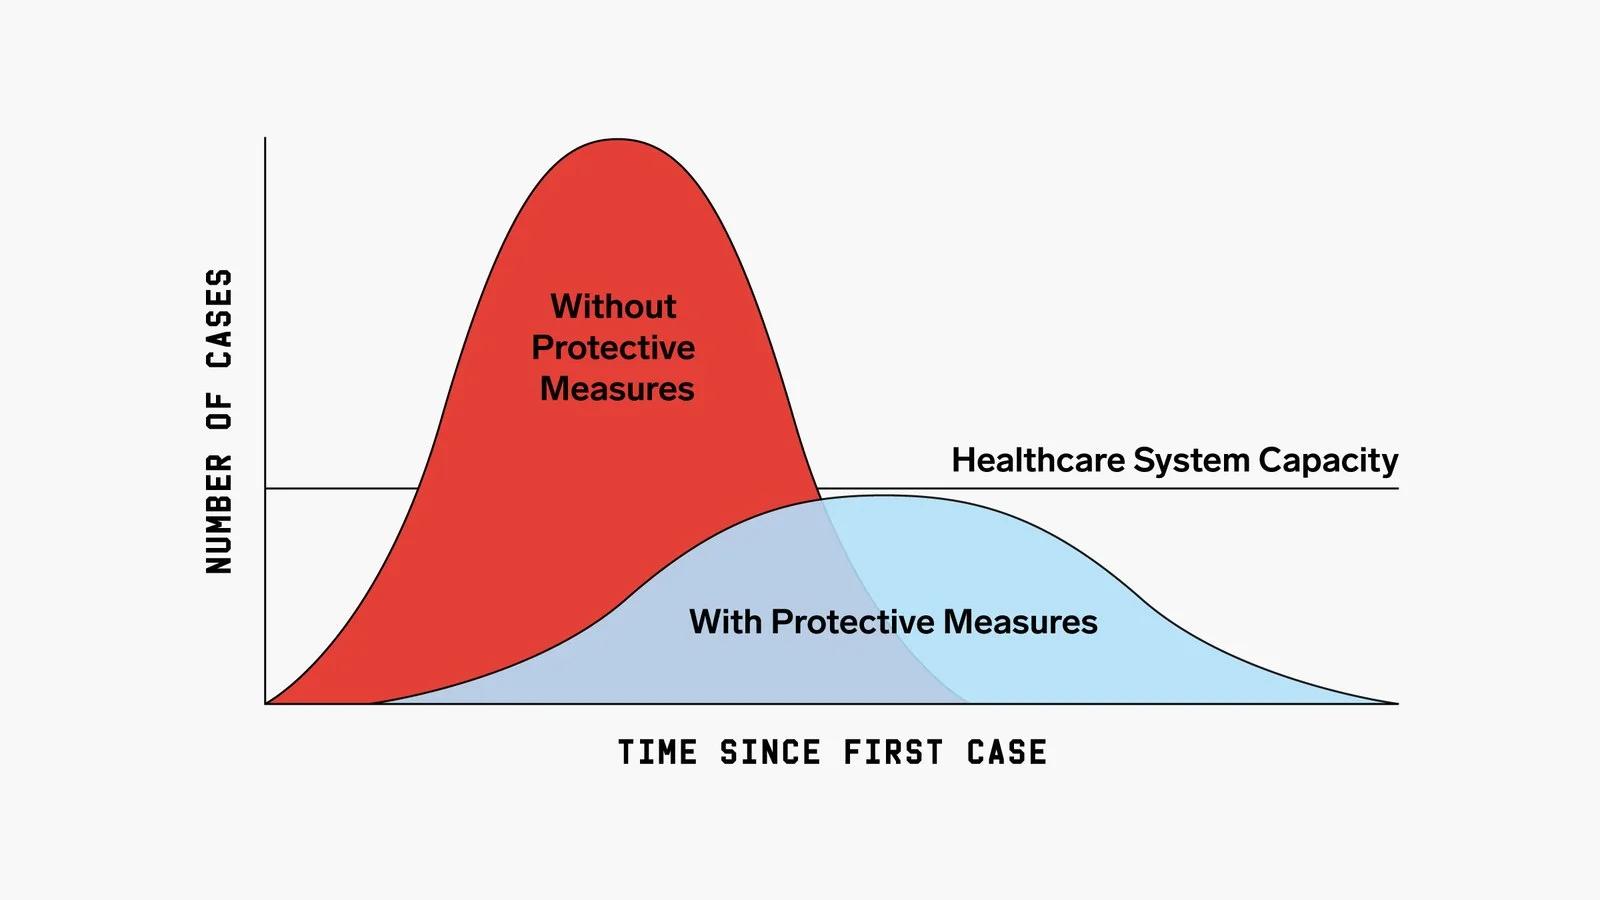
As the figure shows, protective measures can flatten the curve so that the health-care system capacity is not exceeded. We need some math to answer the question: what parameters can one tweak to keep the critical corona cases below that limit? And what is the influence of such parameters?
The mathematicians have done their work. The so-called S-E-I-R model seems to apply (Susceptible - Exposed-Infected - Recovered). The linear differential equations look reasonable, but some more background on what it all means wouldn't hurt. Google to the rescue and, as so often, Stanford University delivers. A neat document by Prof. Jones on R0 helps in understanding the math.
So, can we implement this? well, there is python, numpy, scipy and matplotlib. And all the necessary magic is bundled in Christian Hill's book Learning Scientific Programming with Python, with some minor extensions to handle the SEIR model. Python code including rendering.
Seems we now have all the tools we need. Some questions though remain: what are the parameters? Clearly, covid19 is such a new beast, all parameters remain very fuzzy. So is presumably the entire model. Are people who have recovered from the disease immune or could they become re-infected? What is truly the mortality rate? the duration of incubation? the percentage of severe cases versus more benign onsets?
Good numbers are not yet well-known. But, for a back-of-the-envelope calculation we can run some plausible numbers, see also the post of Christian Hubbs, taking a data-scientist approach to estimate the influence of social distancing.
Important to understand: there may be more accurate models, for example on the Wuhan situation. We simply use very summary parameters in the SEIR model:
- alpha : the inverse of the mean incubation period
- gamma : the inverse of the mean infectious period
- R0: the basic reproduction rate
- beta : the average contact rate which we derive from R0 and gamma.
For alpha, beta, and R0 the Web gives some numbers which appear plausible enough for our purpose.
And to make a long story short and as is shown in the plots further below, the number of encounters between infected people and people susceptible for infection is a highly relevant parameter.
To model the influence of limiting contacts, we use a further parameter
- rho : which indicates the limitation of contacts due to social distancing ranging from no contact at all to unrestricted contacts. When rho equals 1, no limitation of contacts take place. When rho is reduced to say 0.5, only half of the average number of encounters take place.
The effects of the so-called social distancing are meant to limit contacts susceptible for virus transmission. This can be achieved in a couple of ways: staying at home and meeting no-one, keeping distance of 2 m or more from fellow humans, or wearing space-suits to avoid infection. Your choice!
The below graph shows the impact of limiting contacts (without saying how this is achieved - only the effect matters).
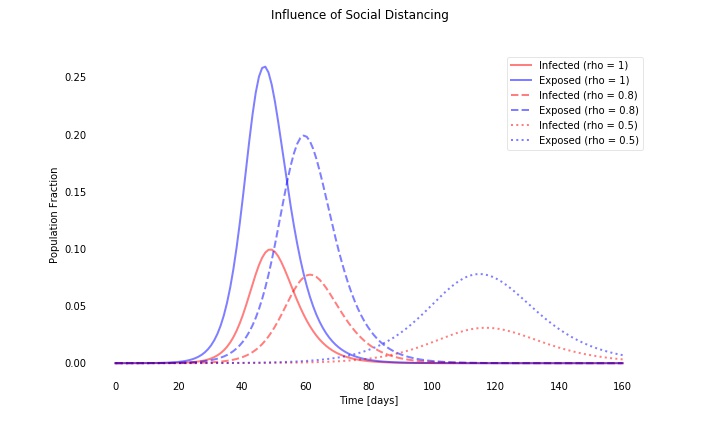
Intuitively social-distancing makes sense, the impact in the models are however stark. Not only does the peak number of infections decrease (as a percentage of the overall population), but it also delays the peak in time. That is why health-officials these days really want you to stay at home and meet as few people as possible.
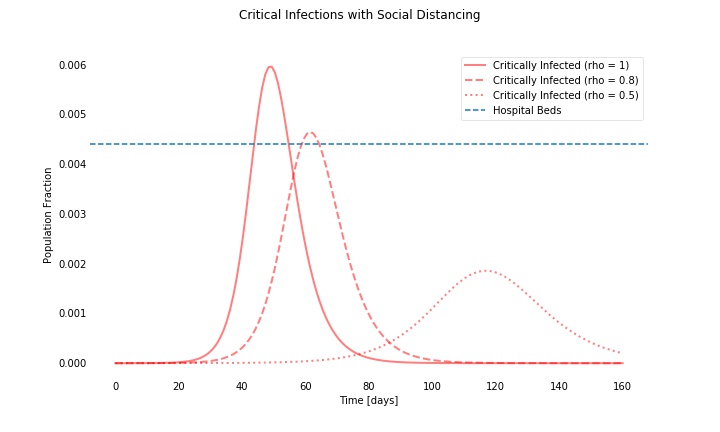
Another finding seems to be that in many scenarios there won't be enough hospital beds. The tsunami of the virus will flood the health-care system - depending on the rate of infections, the number of average contacts, the percentage of severe cases, and some percentage of available hospital beds per capita. (we have taken a somewhat optimistic percentage of hospital beds by including all hospital beds of a country with a strong health-care system.)
In summary, no claim here is made for scientific discovery, nor for excessive accuracy. The model is summary, the parameters based on coarse estimations of averages. Nevertheless, the model seems to show why social distancing is tremendously important.
It might come back to Blaise Pascal's wager: if the hypothesis is correct, the gain is huge. If on contrary the hypothesis were wrong, the loss is bearably small.
In March 2020, we have seen on-line applications, accessible over WWW, which illustrate the above. A neat and succinct epidemic calculator by Gabriel Goh illustrates the SEIR model. A more refined, Swiss centric, and hopefully trustworthy COVID-19 scenario explorer was made available by the University of Basel's team around Prof. Neher.
And of course, given ample spare time in isolation and a super-computer of the 1980s - aka. lap-top of 2020 - I couldn't resist either and put together a SEIR simulator. Note that this is a TypeScript application which runs on your browser and thus, its performance may depend on your hardware, be it a PC, lap-top, or tablet.